Aerospace SOLUTIONS Cure monitoring of HexFlow® RTM6-1
Mastering RTM6*©
The aim to monitor the Tg of aerospace composite parts in a reliable, quantifiable and non-intrusive way throughout the manufacturing process is old but unfulfilled. Until now…
Synthesites has achieved to track the reaction of the most popular thermoset resins for serial production of RTM parts until full cure, accurately predicting the Tg evolution at the end of cure at real industrial conditions.
As Synthesites is involved in several industrial Aerospace projects for real-time monitoring of the processing popular monocomponent resins, we have built a unique knowledge on how to monitor the evolution of Tg under any standard or non-standard cure cycle, taking into consideration the whole resin history from the resin pot.
As an example of monitoring a non-conventional cure cycle, the resin injection of an aerospace curved part in a RTM mould cured in a large oven was monitored. For the process monitoring, an Optimold system was used in combination with a durable in-mould sensor recording the resistance and temperature throughout the cure cycle. The real-time prediction of the Tg and degree of cure is challenging because of the existence of highly compacted carbon-fibre preform and the distance between the Optimold monitoring system and the cure sensor inside a high temperature oven.
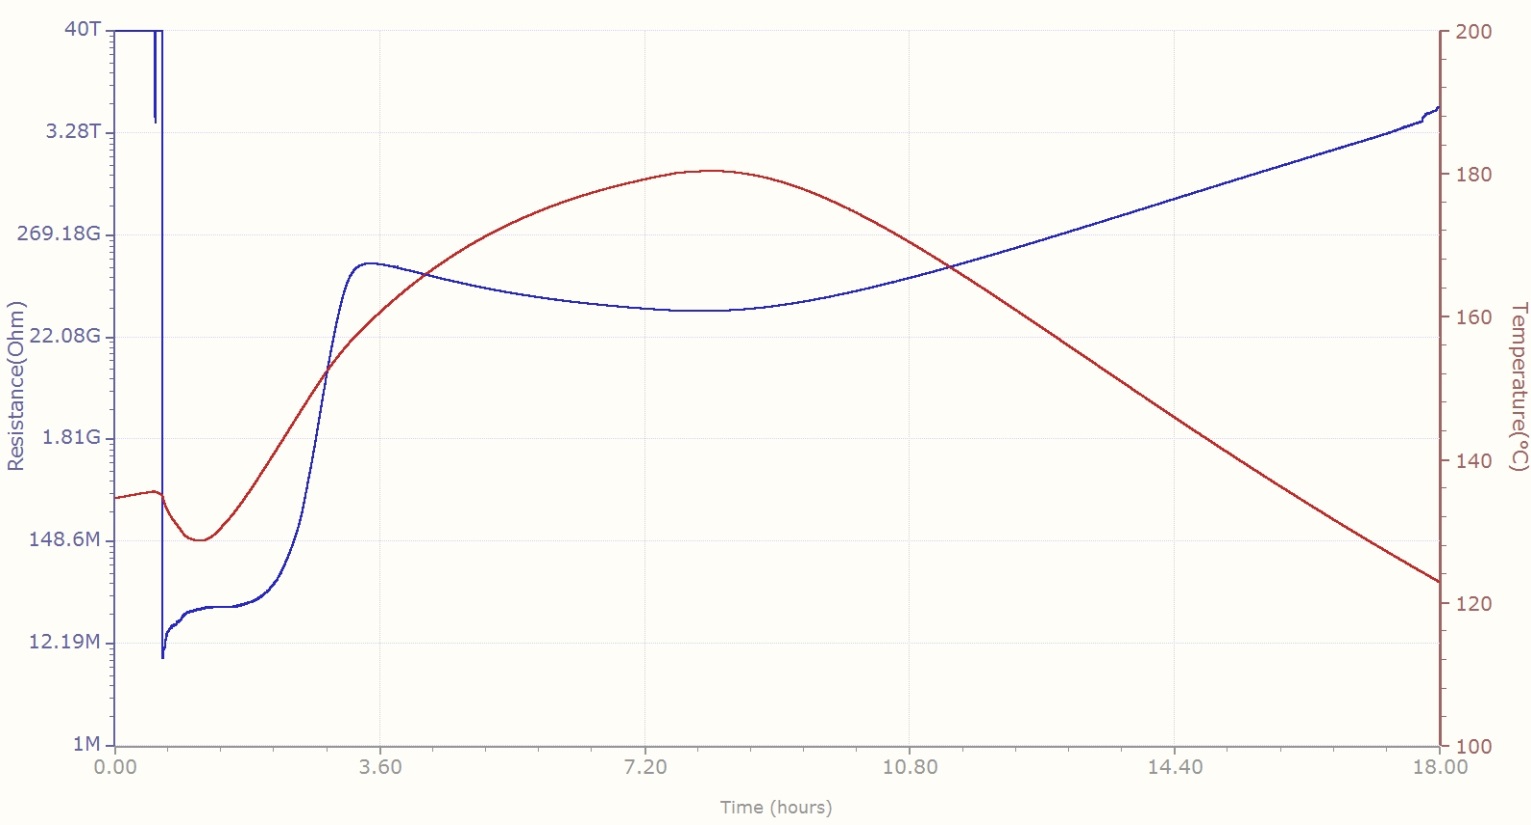
Figure 1. Recorded Resistance (blue curve, left vertical axis) and tool temperature (red curve, right vertical axis) vs processing time.
Correlation between Electrical Resistance and Tg (Glass Transition Temperature)
Furthermore the strongly non-isothermal cure cycle that was implemented as can be seen in fig.1 makes the real-time degree of cure and Tg prediction even more challenging.
Taking advantage of Synthesites’ unique modelling tools at first the effect of the temperature to the resin’s resistivity is compensated as can be seen in fig.2.
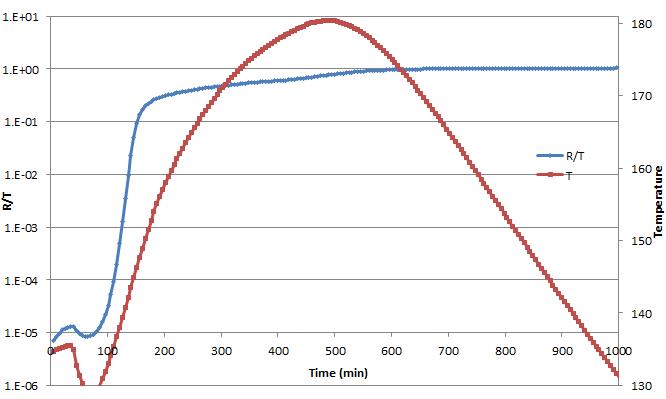
Figure 2. Temperature-compensated Resistance (R/T) and tool temperature (T) vs processing time (0’ @ resin arrival).
|
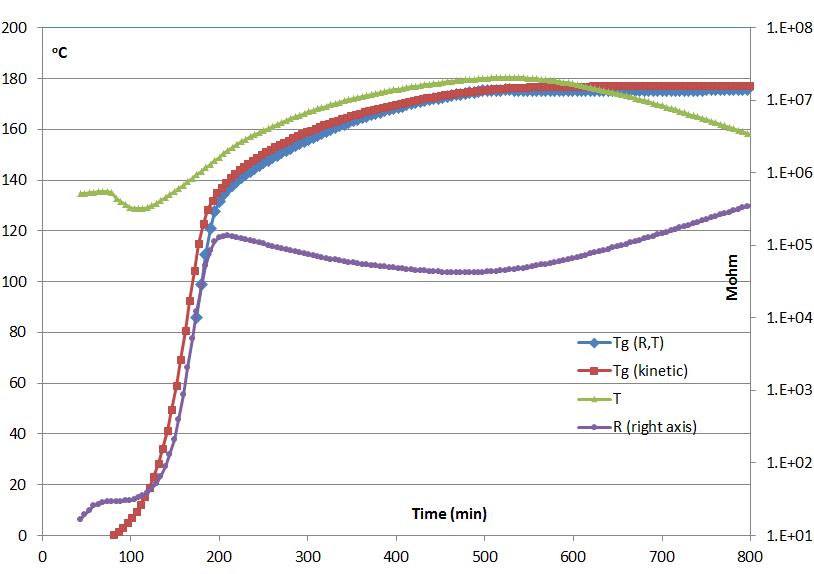
Figure 3. Recorded Resistance and tool temperature together with Tg evolution calculated using R and T (Tg (R,T) blue curve, left vertical axis) and only T (Tg(kinetic) red curve, left vertical axis) vs. processing time.
|
At the final step, we can calculate in real-time the Tg evolution (Tg(R,T)) from the measured resistance (R) and temperature (T). As can be seen in fig.3 this Tg prediction is very well correlated to the Tg calculated by a kinetic model using only the recorded temperature. However, only using Optimold any process deviation can be taken into account, and more important, in real-time, so control actions can be taken to ensure the high part quality according to the specs.
Correlation between Electrical Resistance and viscosity for resin batches of various storage time
In order to study the correlation between resistivity and viscosity we used a special viscometer with an integrated cure sensor so that resistivity and viscosity can be measured simultaneously. Running this trial for three RTM6* resin batches of different storage we managed to correlate viscosity and resistance with respect to the aged batches as can be seen in fig.4.
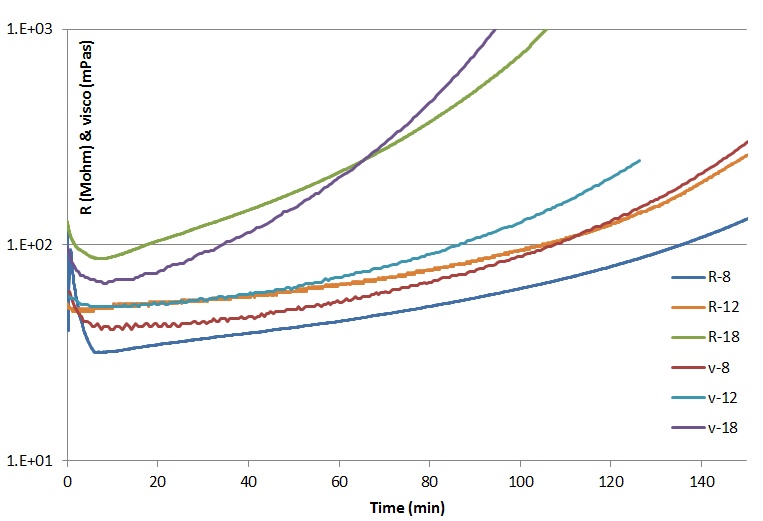
Figure 4. Evolution of viscosity and resistance of 3 RTM6 batches of different storage time
*RTM6 and CYCOM890 are registered trademarks and properties of Hexcel Composites and Solvay SA, resp.